THETA ANALYZER — Data to Visual Insight
A multi-role program and project management platform that transforms structured project data into interactive visual charts, reports, and actionable insights.
Data to Visual Insight
Theta Analyzer is a multi-role program and project management platform designed to transform structured project data into clear, interactive visual insights.
The platform supports the complete workflow from creating programs and projects to collecting, reviewing, and visualizing submitted data. Instead of working with raw data alone, users can configure charts and convert project information into visual reports that are easier to understand and analyze.
Managing Complex Multi-Role Workflows
The system needed to support complex project workflows while keeping large amounts of structured information manageable.
Different users interact with the same project at different stages, so the interface required clear role boundaries, consistent data flow, review states, and visualization tools without making the application difficult to navigate.
Frontend Architecture & Implementation
I worked on the frontend architecture and implementation of the platform, translating complex program, project, review, and analytics workflows into reusable and responsive interfaces.
My work included dashboard interfaces, program and project management flows, dynamic forms, data visualization, role-specific experiences, filtering, reporting interfaces, and API integration.
End-to-End Data Lifecycle
Platform Functionality
PROGRAM & PROJECT MANAGEMENT
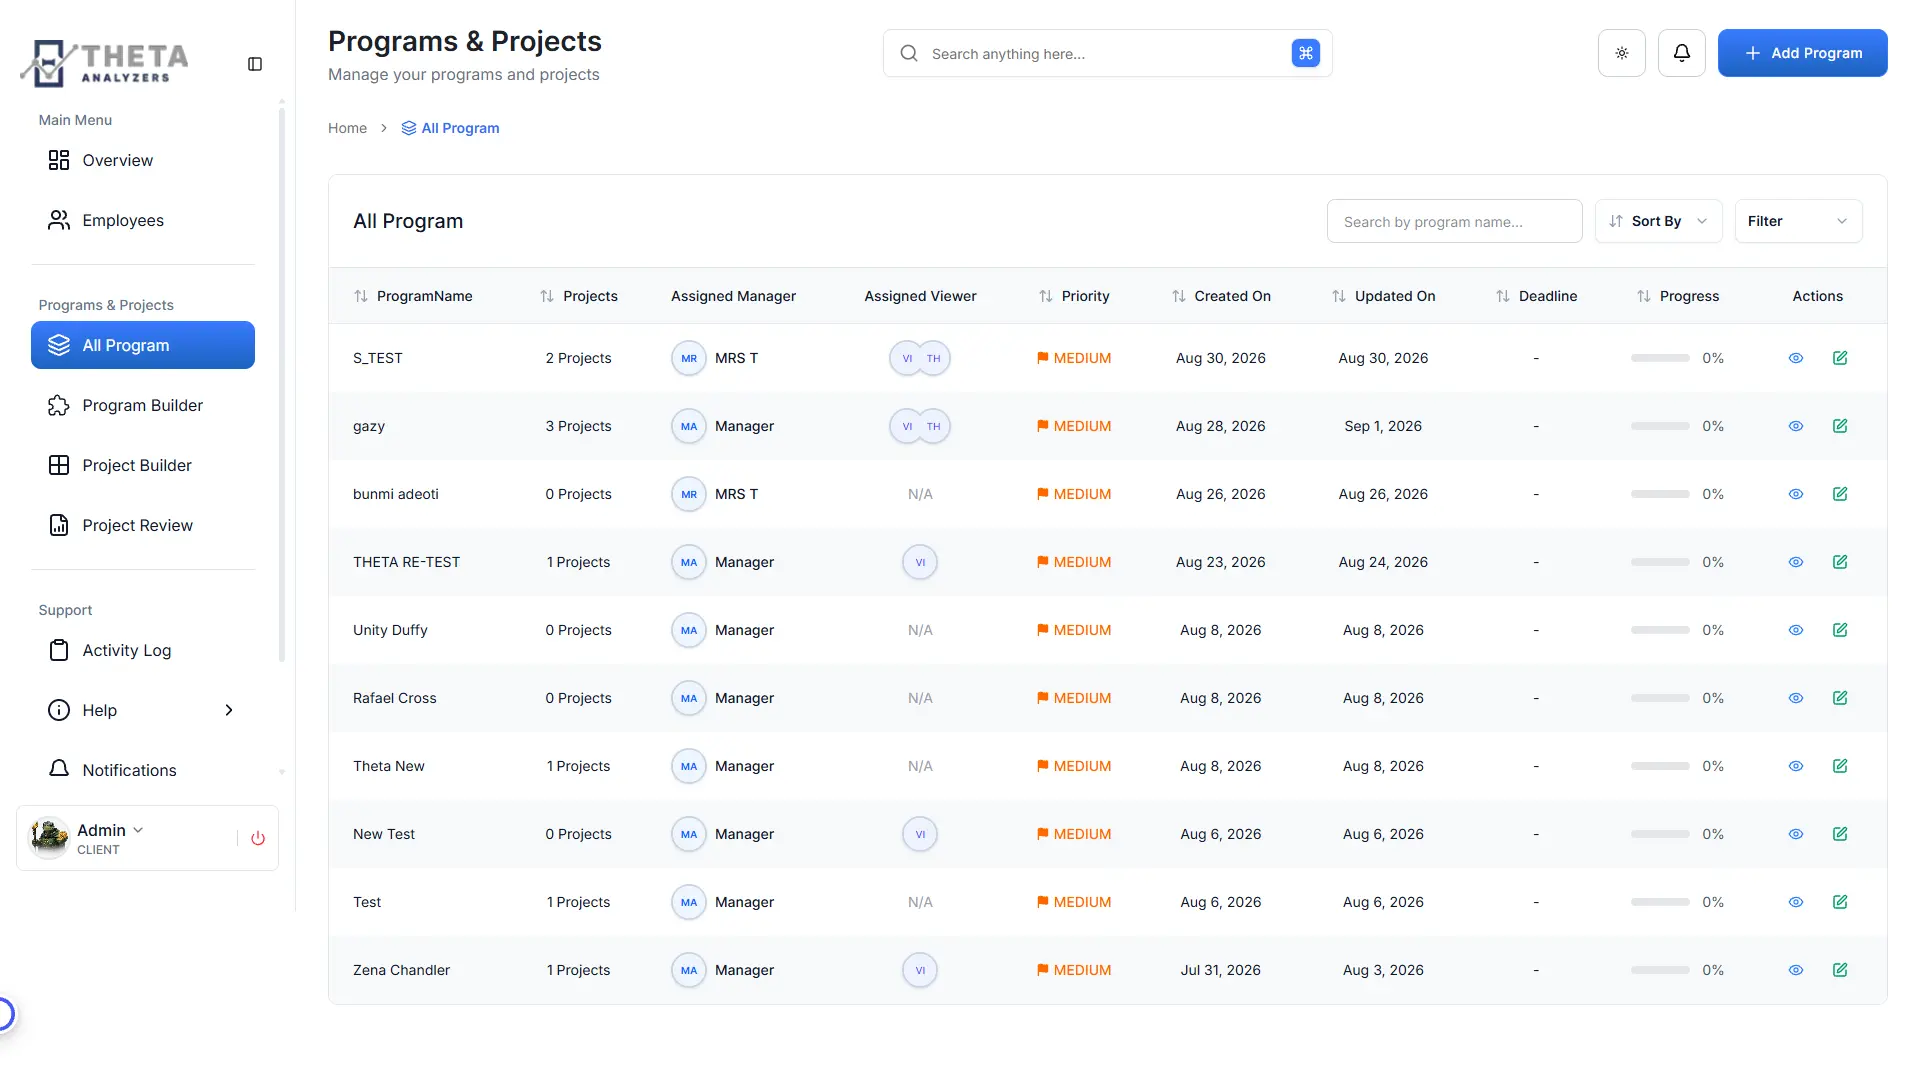
Users can create and manage programs and projects through structured builder workflows while tracking their status, progress, assigned users, timelines, and deadlines.
DYNAMIC DATA VISUALIZATION
Project data can be transformed into configurable visual charts, allowing users to interpret collected information without manually creating reports from raw datasets.
CHART BUILDER
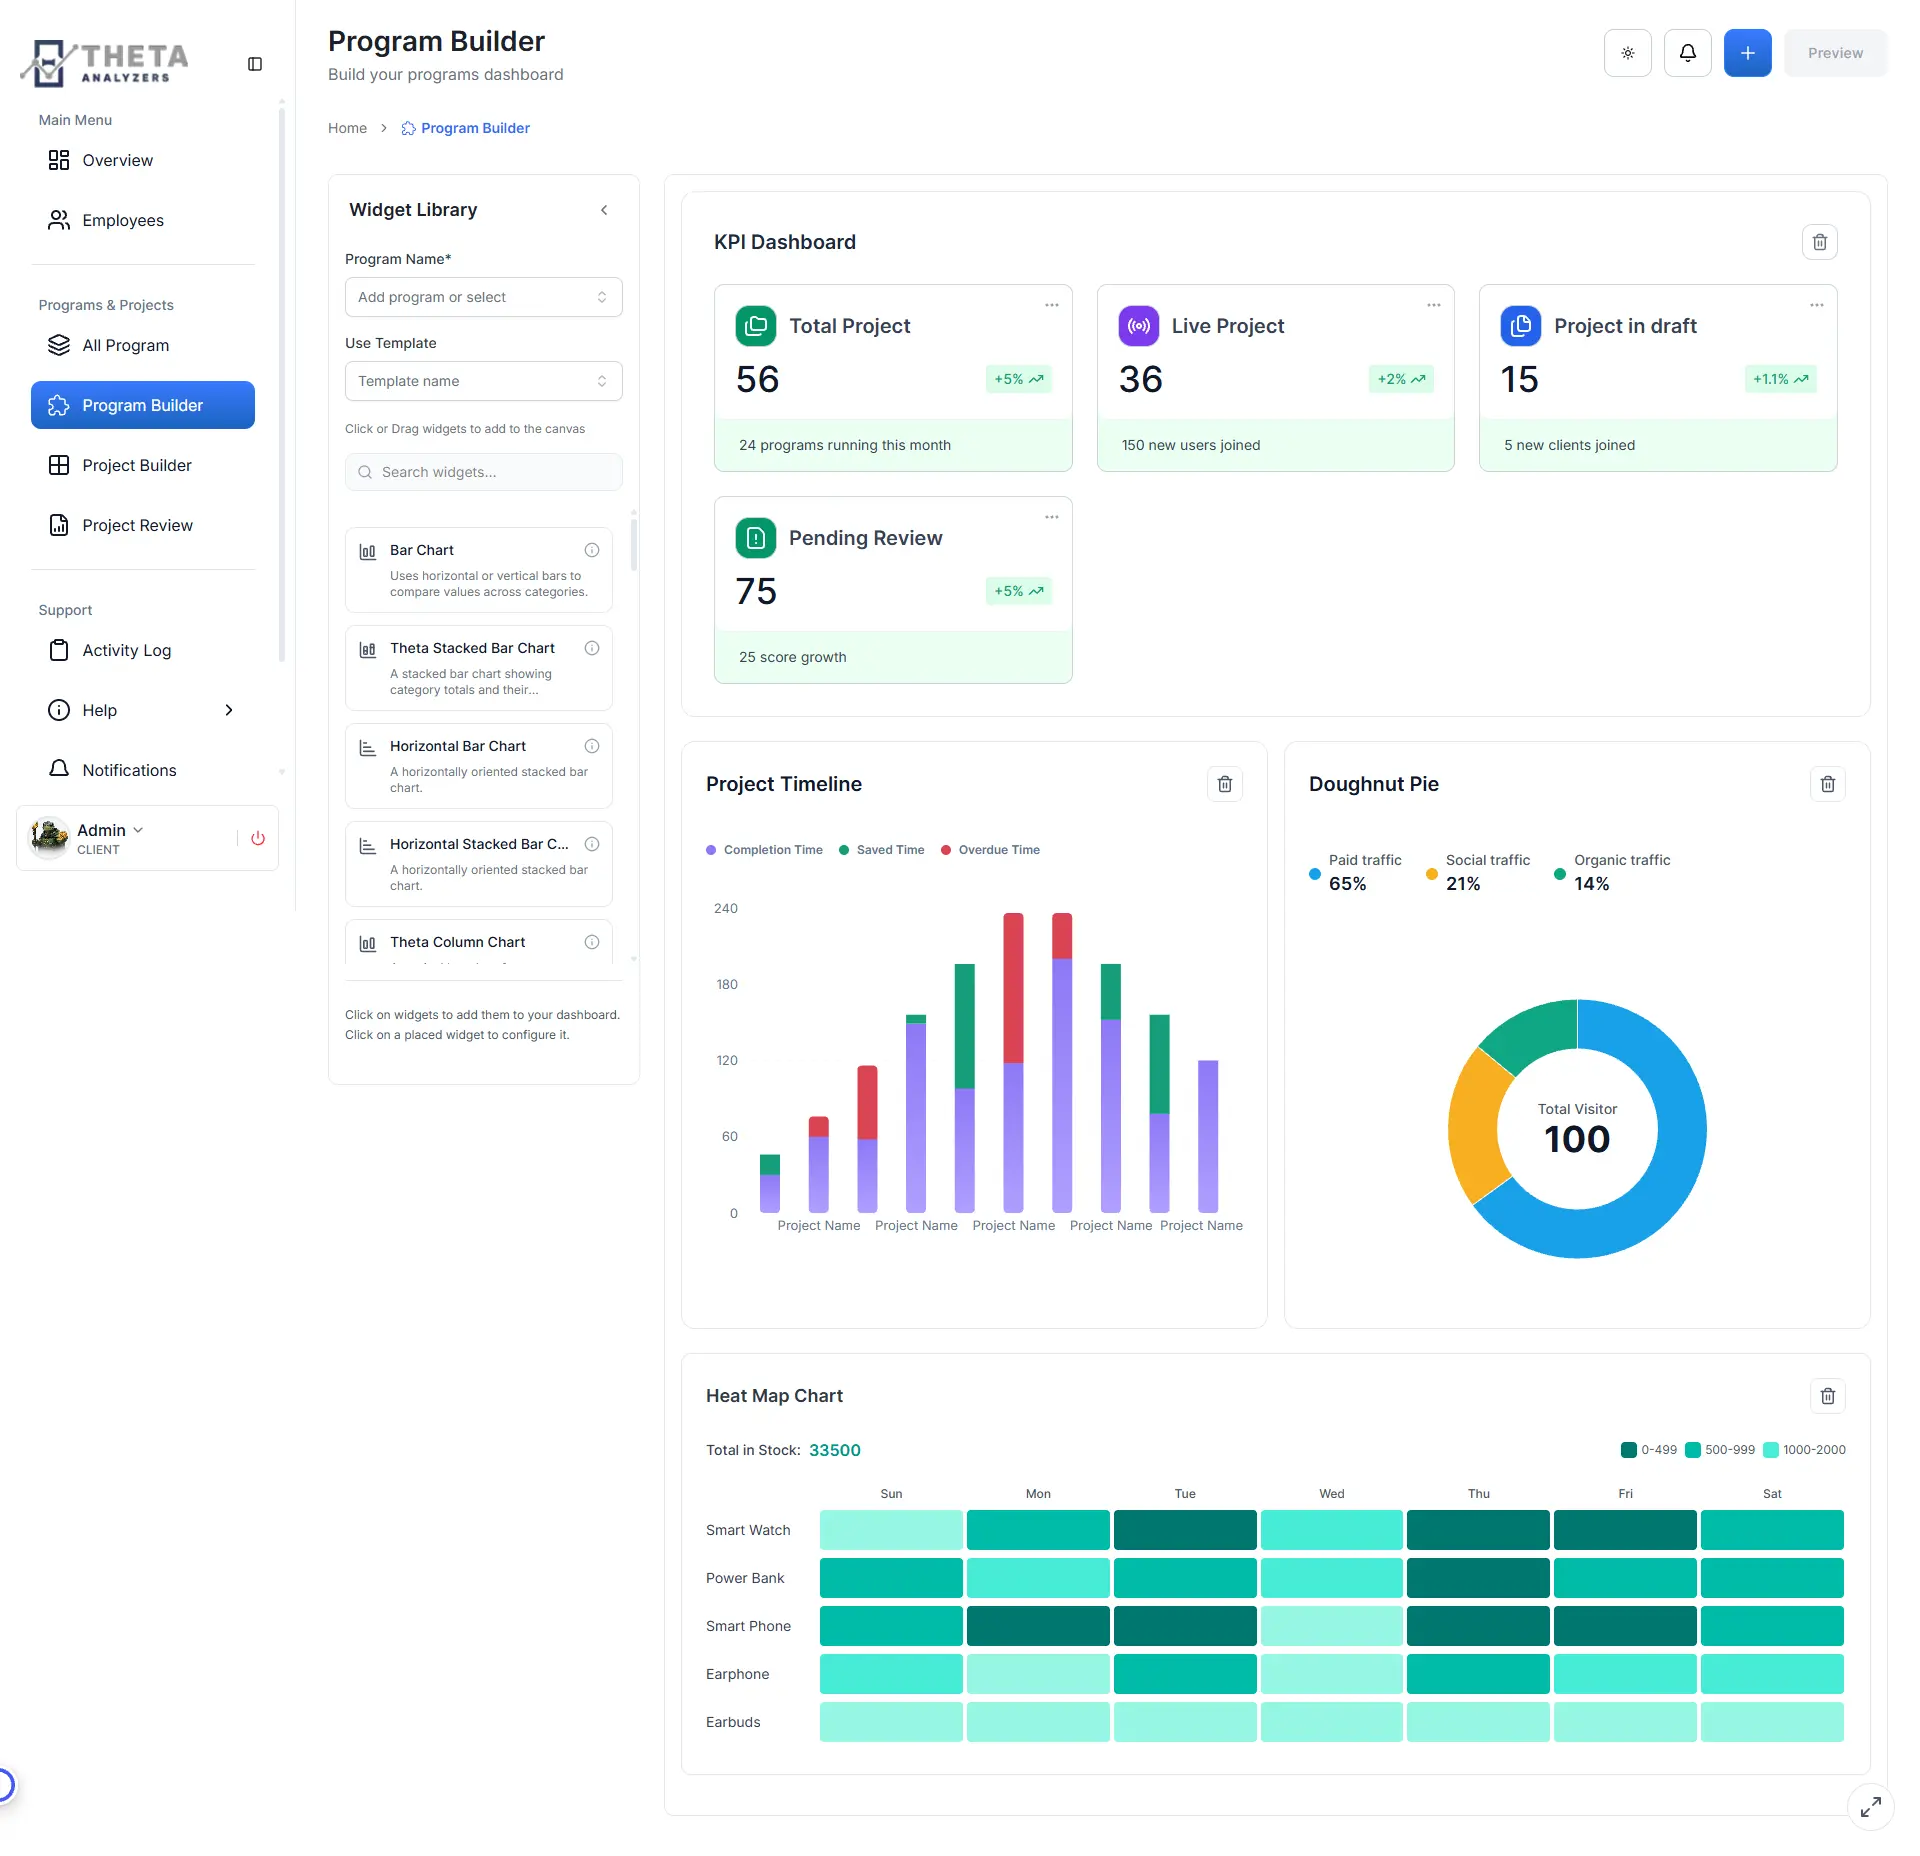
Users can select chart configurations, map available project data, customize chart properties, and save visualizations for later analysis.
MULTI-ROLE WORKFLOW
The platform supports four user roles that participate in different stages of the data lifecycle. Role-aware interfaces and permissions keep project creation, participation, review, and analysis responsibilities separated while maintaining a connected workflow.
PROJECT REVIEW
Submitted project information moves through a structured review process, giving responsible users visibility into pending submissions, approvals, project status, and required actions.
ANALYTICS DASHBOARD
Dashboard views summarize programs, projects, drafts, deadlines, overdue work, project status, activity, timelines, and recent submissions so users can understand system activity from a single interface.
FILTERING & REPORTING
Analytics and visualization interfaces support contextual filtering, including date-based analysis, helping users focus on relevant periods and datasets.
PDF EXPORT
Visual reports and chart-based analysis can be exported for sharing and offline reporting.
ACTIVITY & AUDIT VISIBILITY
Activity tracking provides visibility into important actions across programs and projects, improving traceability within the platform.
Data Flow Pipeline
Theta Analyzer connects project creation, structured data collection, review, and visualization within one workflow. This allows project data to move from operational input to analysis without requiring users to manually rebuild datasets for reporting.
Centralized System Dashboard
The dashboard provides a centralized view of program and project activity, including project status, drafts, overdue work, upcoming deadlines, timelines, submissions, and recent system activity.
Program & Project Builders
Program and Project Builder workflows organize the information required to create, configure, and manage projects while keeping complex forms and project structures understandable for users.
Data Visualization & Reporting
Visualization tools allow users to convert collected project data into charts that can be configured, saved, filtered, and used for reporting. This reduces the gap between data collection and interpretation.
Multi-Role Security & Permissions
Four user roles participate in different parts of the platform workflow. Each experience exposes the actions, project information, and review tools relevant to that user's responsibilities while maintaining a shared underlying project lifecycle.
Interested in a similar system?
Let's build dynamic data applications with performance and craft.